
We provide products, solutions and services for a wide range of applications across diverse sectors.
Everything we offer has one common denominator: the association between data and geographic factors. This geographic information enables an optimisation of all business processes by introducing the ‘where’ factor.
Everything we offer has one common denominator: the association between data and geographic factors. This geographic information enables an optimisation of all business processes by introducing the ‘where’ factor.

Our partners
TomTom
Since the takeover of Tele Atlas at the end of 2007, TomTom is a leading provider of digital cartography.
The company has a large, detailed digital cartographic database, which is used as a base for a multitude of different applications. TomTom is continually expanding its coverage, including more additional information in its database and consistently updating its data so that it can remain an outstanding benchmark in this highly specialised market.
www.tomtom.com

Our partners
Synergis
Since 1973, SynerGIS (formerly datamed) has been the leading Austrian provider of GIS solutions based on software from market leader Esri. SynerGIS is also a one-stop-shop that sells their own software, consultancy & development, implementation, training and support. Besides geoinformatics, process-oriented infrastructure management is also an important line of business in today’s enterprise.
www.mysynergis.com

Our partners
Lutum + Tappert
Based in Germany, Lutum + Tappert is a partner with proven geomarketing expertise. The company was founded in 1982 and develops professional geomarketing solutions, including desktop mapping, sales region and site location optimisation, intranet and internet applications, and cloud services. It also produces and updates an extensive inventory of digital maps.
www.infas-LT.de

Our partners
WiGeoGis
Since WIGeoGIS was founded in 1993, it has been developing innovative geomarketing and GIS solutions to support spatially differentiated market development. WIGeoGIS combines company data with both population and economic data using maps. Their solutions have been proved to provide a sustainable and quantifiable increase in efficiency of growth, marketing and sales. WIGeoGIS develops WebGIS software, provides customers with tailor-made analyses and sells geographic data.
www.wigeogis.com
The ArcGIS platform

| Graphic maps and business maps enable CEOs and executive managers to gain a quick overview. Trends can be recognised early on, allowing companies to react quicker. GIS analysts have never been in such high demand as they are today, to prepare the vast volumes of geographic data, as well as a company’s own data. Today, global information systems can be integrated into the Office environment using add-ins. | Team members are now given a geographic overview of data that was formerly provided in tables and charts. The GIS should no longer be a separate, stand-alone IT tool within a company but should be increasingly integrated into the operational procedures of all departments. Map-supported communication also plays a key role in marketing. |
ArcGIS Online

| The first steps to supporting your web presence with maps – discover, use, create and share your own web maps! Simply set up your ‘organisation’ and design your company’s GIS portal! | Content of named users is not shared outside your company. Content can also be made public, however, if you wish to quickly publicise information. Every ArcGIS for Desktop user is automatically a named user. Additional named users can be added to the organisation. |
ArcGIS for Desktop

| The tried-and-trusted desktop GIS by Esri is a high-performance system to manage and process spatial data. Most of our customers use the basic version of ArcGIS for Desktop. The system can be expanded with a range of extensions and offers a flexible configuration due to in-house programming. | ArcGIS online enables named Esri users to access a vast amount of public geographic data in the Esri cloud. Company-own data that is processed on the desktop can also be shared via the cloud. Every named user (as long as you have a support contract for ArcGIS for Desktop) also has access to ArcGIS Pro. Today’s ArcGIS Pro gives you access to a GIS of the future: The new 64-bit application features faster data processing, as well as the opportunity to manage both 2D and 3D data. |

Consulting

Training

Custom programming

Data processing

Data analysis
Target market analysis
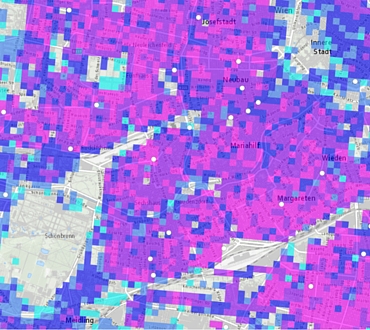
Spatial analysis enables a target market to be determined by overlaying it with geographic information. Target market analysis is based on the assumption that data appertaining to a specific region can be transposed almost directly on top of the addresses therein. Target market analysis helps you win new customers. It allows you to determine the potential number of new customers in a specific region or select addresses to be included in initiatives to win new customers.
Data source: basemap.at
Accessibility analysis
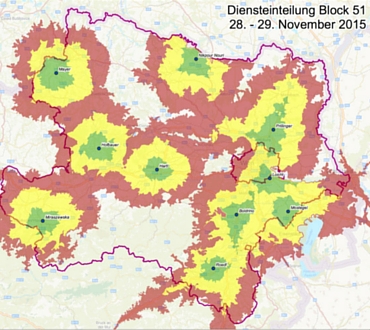
The accessibility analysis is used to calculate accessibility indicators on a small-scale, local level – used for analysing the percentage of customers served, analysing potential and setting territorial boundaries. This process is based on being able to determine travel times to and from important local establishments and places, which resolves a wide range of spatially related issues.
Data source: www.basemap.at
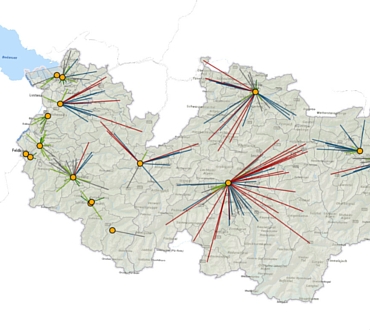
Planning and optimising sales territories
New strategic sales territories can be planned, and existing territories optimised or readjusted, based on specific properties. For example, specific data relating to the territories, such as the number of customers, forecast revenue, the potential of the territory or number of sales calls per year, can be integrated into the planning process.
Data source: www.basemap.at
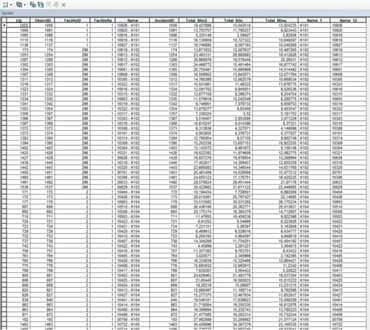
Distance tables
A distance matrix comprises a database or table that contains information about the distance between any number of different places. These distances can be those determined from road networks or represent distances as the crow flies. Distance matrices provide a basis for calculating travel and transport costs, for example. They are also used as a basis for a diverse range of planning procedures in the logistics sector.
A distance matrix comprises a database or table that contains information about the distance between any number of different places. These distances can be those determined from road networks or represent distances as the crow flies. Distance matrices provide a basis for calculating travel and transport costs, for example. They are also used as a basis for a diverse range of planning procedures in the logistics sector.
Geocoding
| Geocoding, or the process of geographically locating addresses, is the process by which precise coordinates are allocated to a specific address. In the best-case scenario, coordinates are allocated to an actual house, while less precise addresses can also be coded to the street or the centre of the city, or the zip-code. Locating addresses is the first step towards successful geomarketing. Geocoded addresses also add value to your address database. The automatic geocoding process involves an automatic comparison with the address stored in the Austrian Post AG’s reference database, or the Austrian address register. | This brings the benefit of ensuring that all address data is correct, legally valid and written in a consistent form. Addresses are then assigned a new selection criterion – their location. This enables geocoded address databases to be filtered by geographic criteria, e.g. addresses within the current catchment area within a 3-km radius around a site, or addresses that are 500 metres to the left or right of a railway line. Geocoded addresses also serve as the basis for online site locator services. |
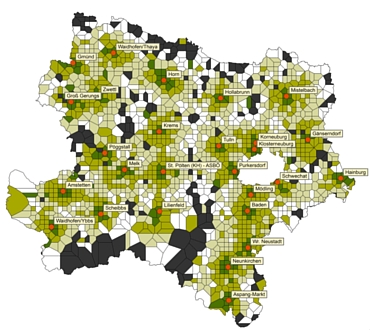
Spatially focused demand analysis
Spatially focused demand planning takes into account regional differences, e.g. resident population or demographics, to geographically optimise the planning and allocation of resources needed to supply an area. For example, this enables bus stops and bus routes to be planned based on data relating to people commuting to school and work on public transport, or the number of out-of-hours pharmacies and emergency doctors needed to cater for a specific population density. Spatially focused demand planning plays an increasingly important role, in particular in the health care sector and in regional development planning.
Data source: www.basemap.at
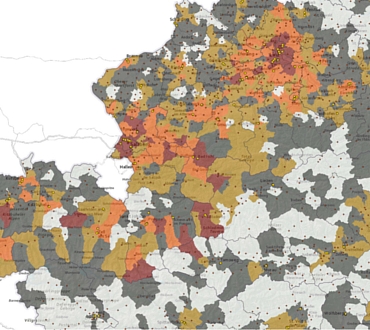
Penetration analysis
Companies strive to evaluate their own potential using a number of comparisons (e.g. productivity, position in the market, etc.). Potential analyses are particularly important for defining objectives when entering a market (e.g. entering new regions or launching new products). Determining purchasing power (e.g. of a particular market, or for a specific product group) is one way of illustrating this potential. This potential can then be compared to revenue to determine how much of this potential can be exploited.
Data source: www.basemap.at
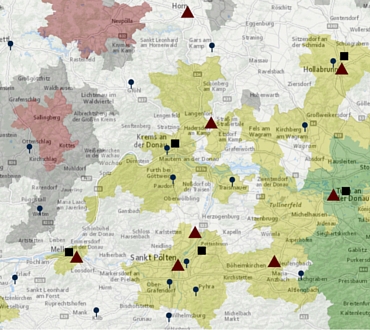
Site planning and site analysis
Decisions relating to new sites require a wide overview of environmental factors. The price of land depends on a large number of parameters (proximity to infrastructures, social environment, noise, etc.), - administrative restrictions determine the use of land (type of utilisation, building regulations, etc.). GIS systems allow these environmental parameters to be expressed visually, including catchment areas and proximity to specific sites. Noise levels and traffic factors can also be overlayed visually. Site analysis enables users to gain an overview of the density of a branch network, compared to the competition. Geo-demographic data is also brought in to provide a complete picture of the environmental setting. When it comes to choosing a site, logistics-related factors (for example conditions for suppliers and for delivery) may also play a determining role.
Data source: www.basemap.at
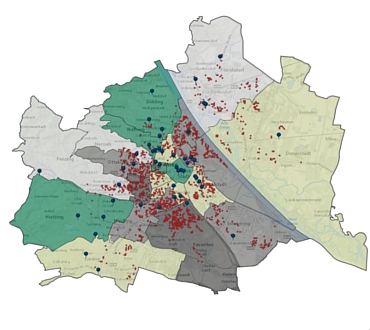
Media planning
Companies try to ‘distribute’ their advertising message to those who ‘need’ it most. Knowing how many households there are to cover in each zip-code area, therefore, is key. Usually, media planners work on specific catchment areas around a particular company location. The denser the branch network, the more important it is for ‘distribution’ regions to be clearly defined in order to prevent certain households from receiving promotional material from different branches. Failure to set clear peripheries costs money and has a negative impact on customer acceptance.
Zip-codes can also be characterised by other criteria (socio-demographic data, purchasing power, targeted company revenue). Regions (typically zip-code districts) can be targeted with promotional material with specific ‘distribution frequencies’ or particular types of brochure.
Data source: www.basemap.at